The vExperts had the chance to attend an exclusive online session recently together with Synology. The topic was “Flexible VM backup and recovery solutions with Synology”. Josue Guzman, Technical Account Manager at Synology, showed us how to set up and use the VM backup solution. He demoed also the whole backup and restore process. And especially the instant restore option, where the Synology NAS mounts itself as an NFS datastore into your ESXi host was awesome.
Many thanks to Corey Romero and the vExpert team for organizing all these cool sessions!
But I’m not going to recap the session here. I just want to pick up the thread because there is a not-inconsiderable amount of space required with backup. And if you also have specific RTO and RPO that have to hold data for a certain period of time, then the storage requirement can be quite large.
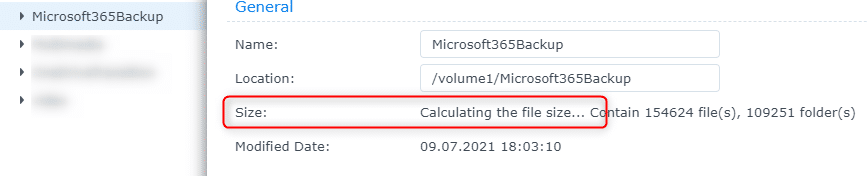
And that’s exactly the thread I want to pick up. When you’re working with Synology NAS systems, you may know how cumbersome it sometimes is to get the size of the various (shared) folders you have on your NAS. Sure, you can do “right-click => select Properties” on every folder, note it down somewhere, and then you can add all the values together. But who wants that?
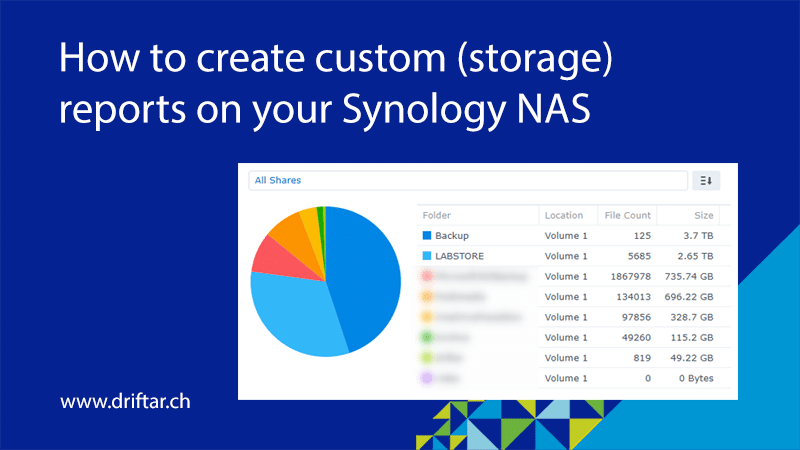
But there is a much nicer and more elegant way to get the folder size. And at the end, you even see colored pie charts. Well, are you curious now?
This blog post will show you how to create a custom (storage) report on your Synology NAS. The reason, why (storage) is written in brackets, is because you can pull many more reports than just storage reports.
Where to start
First, you need a Synology NAS for this. I assume that you fulfill this requirement already if you’re reading this blog post. Second, you might need to download a software package onto your Synology NAS. Let me show you how.
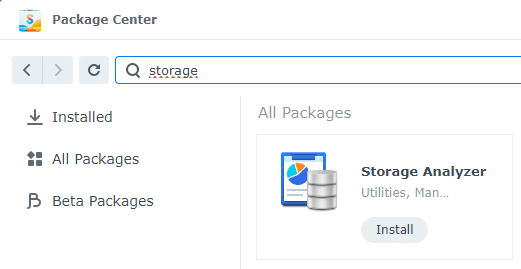
- Open the “Package Center” on your Synology NAS
- Click the “All Packages” menu item on the left
- In the search bar above, search for “storage” (or “analyzer”)
- The app we’re looking for is “Storage Analyzer”…

- The app we’re looking for is “Storage Analyzer”…
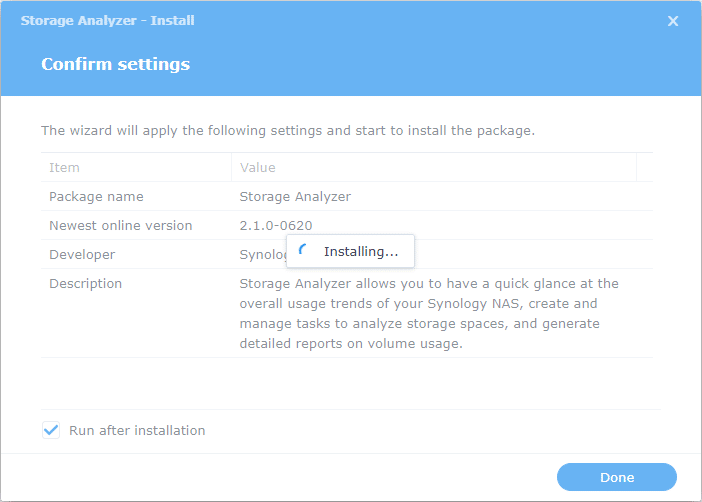
- Click “Install” and wait for the assistant to complete the installation

- As soon as the package is installed, you should find it in the Synology main menu

How to create a report?
Note: If you just installed this package, it might be required to configure the folder/path where to store the reports. It can be any (shared) folder, but you may create one specifically for these reports.
Now, let’s dive into the topic. How do we create a custom report now, to have an overview of the folder size?
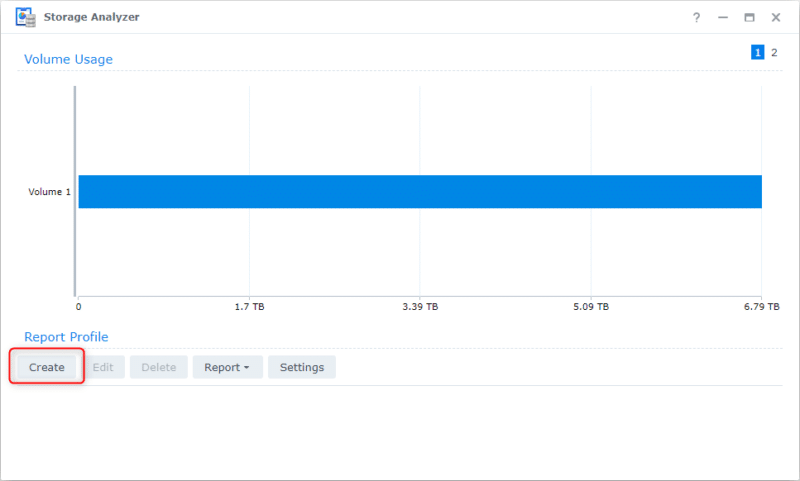
- Open the “Storage Analyzer”
- In the “Report Profile” section, click “Create”

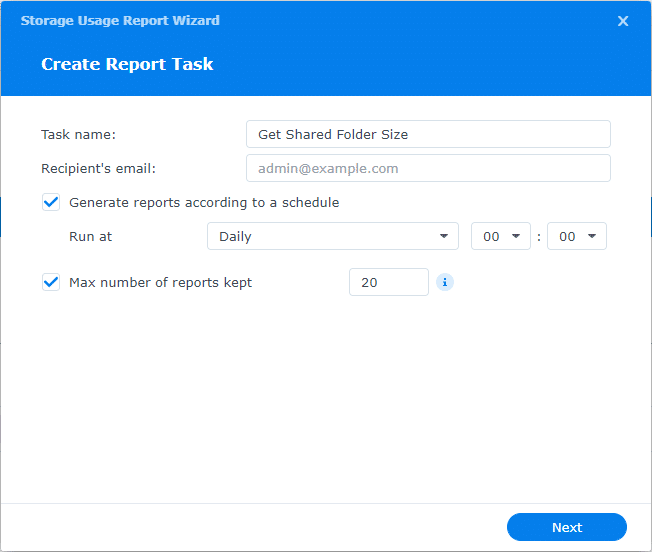
- The Storage Usage Report Wizard shows up. On the “Create Report Task” window, provide a task name, then click “Next”.
- The values for the email recipient, schedule, and maximum number of reports are optional

- I configured the schedule and maximum number of reports because I wanted to keep track of it. But I don’t need a daily email just because of that.
- The values for the email recipient, schedule, and maximum number of reports are optional
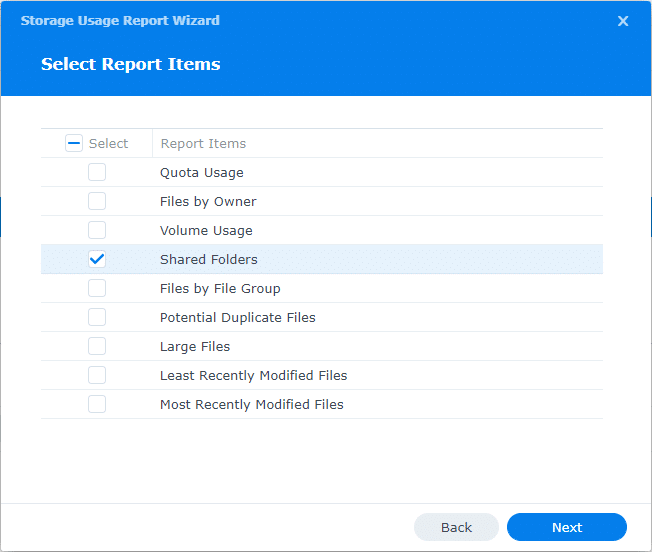
- In the “Select Report Items”, select only “Shared Folders” (as this is the topic of this blog post anyway), and click “Next”.
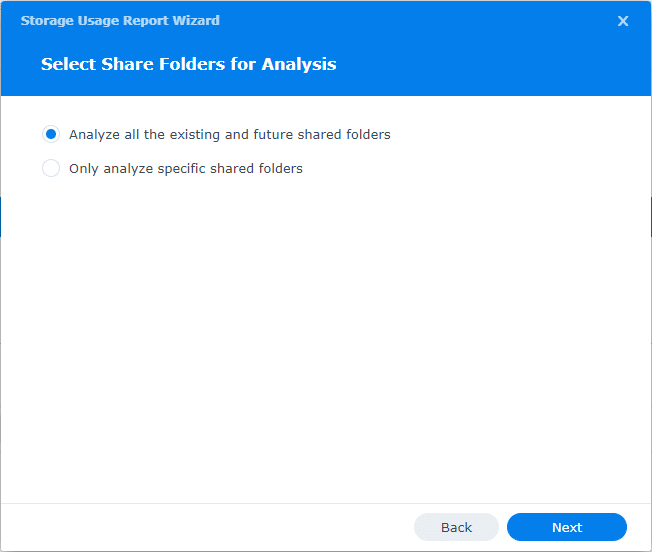
- In the “Select Share Folders for Analysis” window, you can choose between:
- “Analyze all the existing and future shared folders” => Every shared folder that exists right now and will be created in the future
- “Only analyze specific folders” => Select one or more folder(s) that you want to have an eye on its size
- I select the first option because I want to have a holistic overview
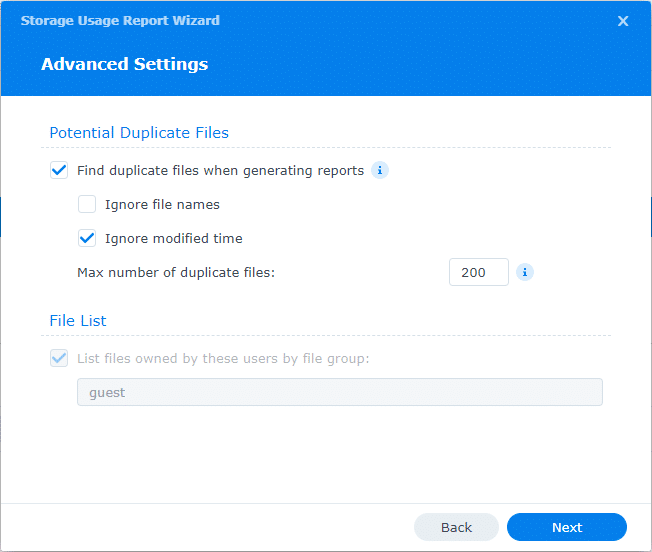
- In the “Advanced Settings” step, Select the options you like, then click “Next”.
- I recommend selecting at least the “Find duplicate files” option (it’s selected by default)
- I recommend selecting at least the “Find duplicate files” option (it’s selected by default)
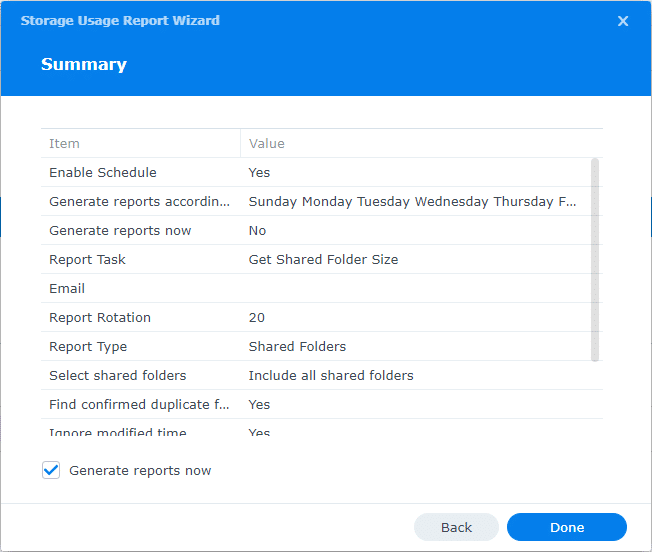
- On the “Summary” page, check all options if they fit your needs, then click “Done”.
- In my example, I selected the “Generate reports now” option, because I didn’t want to wait until midnight to complete this blog post 😉
- In my example, I selected the “Generate reports now” option, because I didn’t want to wait until midnight to complete this blog post 😉
How does such a report look like?
When you have selected the option to generate a report right after clicking “Done”, you will see the assistant running the report task and collecting the necessary information:
Depending on the number of shared folders, their size, etc. it may take a while until the report has been created. That’s also the reason why I have enabled the schedule. Whenever I have the feeling to have a glimpse into the storage usage, I have the latest information. Sure, when I just copied some data onto my Synology NAS right after running the report, the report may not respect this. But that’s expected.
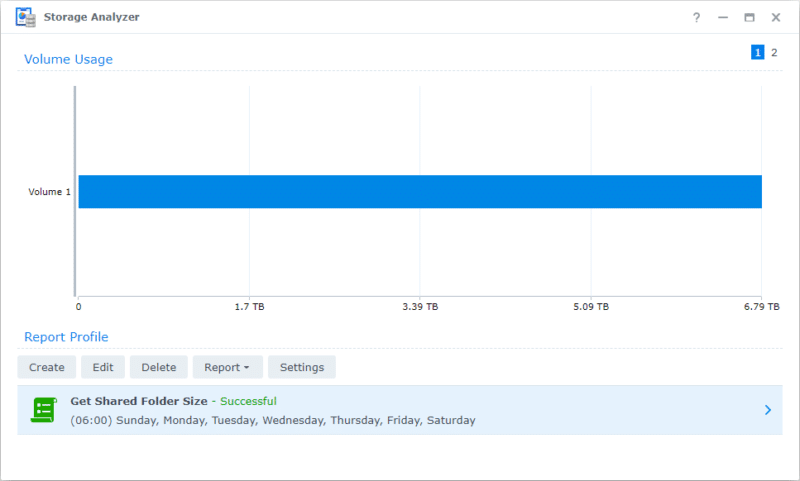
- Open the Storage Analyzer again
- In the “Report Profile” section, you see your recently created custom report
- Double-click the report to get an overview of your custom report

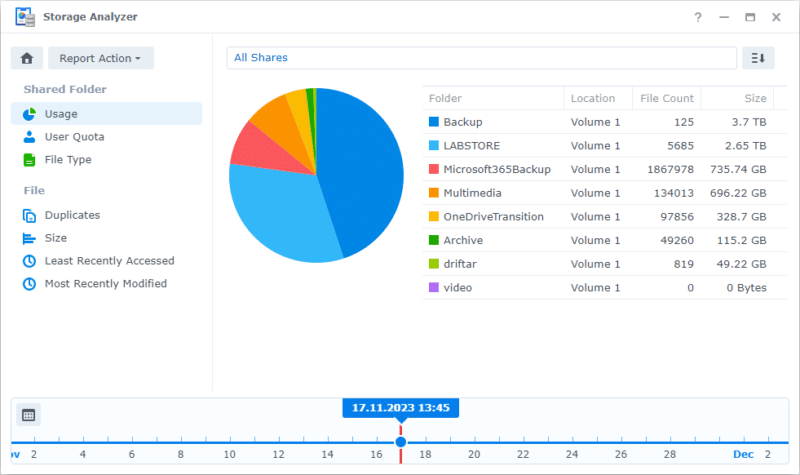
- As you can see, I have quite some stuff lying around on my Synology NAS
- You can see as well that I’m using the Active Backup for Microsoft 365
- This great backup tool can be installed free of charge through the Package Center
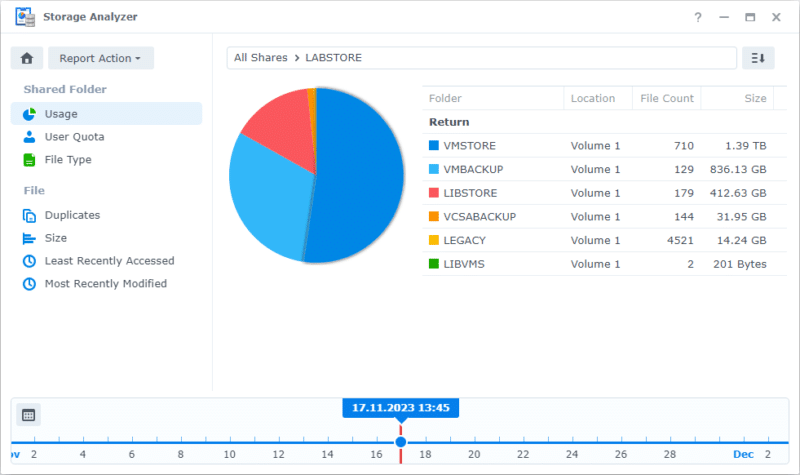
- To further drill down and get a more in-depth view of the storage usage, you can click on the desired folder name
- No, unfortunately, you can’t click or double-click the pie chart parts
The rest of the menu items on the left I’m just going to explain here without going into much detail.
- User Quota: Useful to see how many files are created / how much space is used by the users
- File Type: Another pie chart that shows you what type of files are stored on the NAS
- Duplicates: Very nice feature. But be careful to not delete the “wrong” duplicate file…
- Size: Find the biggest files to see what it is
- Least Recently Accessed: Well, I’m not 100% sure what this means, because the time and date values I see in my example are from 2006. Which is strange.
- Most Recently Modified: This one shows you the most recently modified files. If you’re using the Synology NAS as a datastore to run your VMs, then the VMDK files might pop up here…
Another cool feature, and this one is going to conclude this blog post, is the timeline and the calendar at the bottom of the Storage Analyzer, where you can go back in time to compare the storage usage.
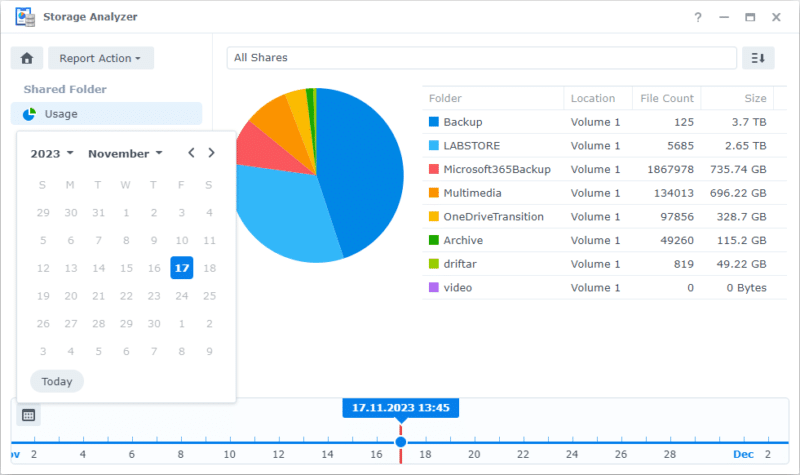
And with this, I wish you a nice day and have fun creating your own custom reports!